

WATER SURFACE MAPPING: METHOD SUMMARY
This section presents a summary of the method developed and applied by the MapBiomas Agua initiative for mapping water surfaces in the Pan-Amazon region. For a detailed description of the theoretical foundations, algorithms, parameters, and procedures, please refer to the ATDB – Algorithm Theoretical Basis Document, available at the following link: LINK).
Presentation
The main objective of MapBiomas Agua is to map surface water dynamics across the entire territory of the Amazonian countries (Pan-Amazonia) on a monthly and annual basis from 2000 to 2024. The datasets are publicly available on a web platform to improve the management and use of water resources throughout Pan-Amazonia. With regard to glaciers, the data cover the period 1985–2024. For more information on the methodological details, please refer to the ATBD (Algorithm Theory Base Document) at this LINK
The generated products are openly available through the MapBiomas Venezuela web platform, allowing for consultation, visualization, analysis and download in different territorial units and time scales.
Organization and database
In Venezuela, the methodological development, algorithm adaptation, and results validation of the MapBiomas Agua initiative were carried out by national specialists, with the participation of organizations with extensive experience in conservation, environmental monitoring, and land management.
The monthly historical series of water surface area was reconstructed from Landsat satellite images processed on the Google Earth Engine platform, ensuring spatial, temporal, and methodological consistency throughout the entire analyzed period.
Generated Products
MapBiomas Agua Venezuela produces the following datasets:
- Monthly maps: provides the water surface area for each month of the year.
- Annual maps: These maps show the annual coverage mapped for the entire Venezuelan territory. The data covers the period 2000–2024 and shows the presence of water.
- Water frequency: provides annual information on the persistence of the water surface in Venezuelan territory.
- Annual water bodies: presents the detailed classification of water bodies in Venezuela, showing the different categories according to their origin and use, including natural water bodies (rivers, lakes, oceans and lagoons of glacial origin) and anthropogenic ones (reservoirs for drinking water supply, irrigation, mixed use, hydroelectric, aquaculture, oil and gas extraction, mining and other uses).
These products are integrated into an interactive dashboard that includes maps, charts, statistics and analysis tools, as well as access to direct download of data and maps.
Method
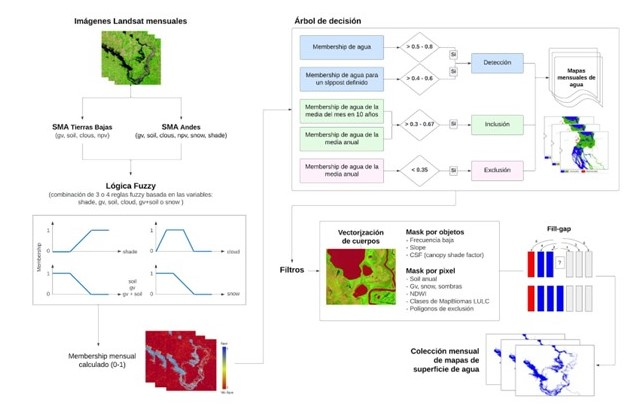
The mapping of surface water in Venezuela is based on a subpixel classification approach, called the Surface Water Subpixel Classifier (SWSC), complemented by decision rules, fuzzy logic, and post-classification procedures. This approach allows for more accurate detection of surface water, even in mixed pixels and in complex environments such as wetlands, floodplain rivers, and reservoirs (see Figure 1).
Figure 1. Stages of the process of classifying the surface and bodies of water in Venezuela.
Preprocessing
Images from the Landsat archive available on Google Earth Engine were used, corresponding to the TM, ETM+, and OLI sensors, with a spatial resolution of 30 meters. The images were selected considering criteria of radiometric quality and cloud cover, and the orthorectified collection was used to ensure geometric and spectral consistency.
Water surface classification
The SWSC classifier uses spectral fractions derived from Spectral Mixture Analysis (SMA), specifically the fractions for shade, green vegetation (GV), soil, and clouds. From these fractions, hierarchical binary decision rules and independent fuzzy logic-based rules are applied, assigning each pixel a membership level to the water class.
The membership values, ranging from 0 to 1, are aggregated for each month using robust statistics and classified using empirically defined thresholds to generate the monthly water surface maps (see Figure 2).
Subsequently, post-classification procedures are applied, aimed at:
- Restore false negatives,
- Eliminate false positives associated with shadows and dark objects
- Fill gaps caused by cloud cover or temporary absence of observations, using rules based on intra-annual probability and the historical monthly median.
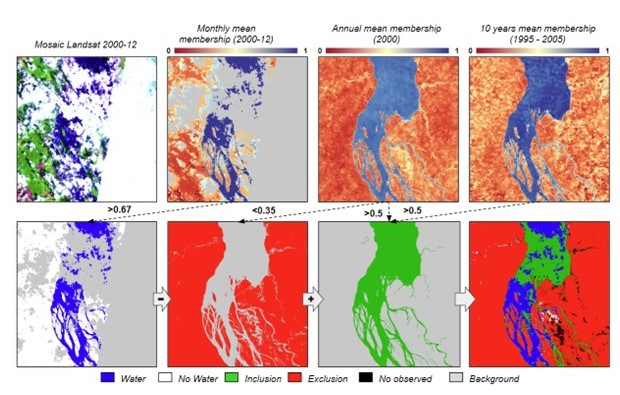
Figure 1 Example of detection, inclusion and exclusion of information applied to the mapping of monthly surface water.
Annual classification and water frequency
Based on the monthly maps, annual water surface maps are generated, incorporating frequency of occurrence information. In this process, a distinction is made between permanent water bodies (present for six months or more of the year) and seasonal water bodies (present for one to five months).
Additionally, the frequency of water detection is calculated throughout the entire historical series, allowing the identification of patterns of persistence and hydrological variability.
Classification of bodies of water
The classification of water bodies is performed using information derived from the annual mapping of permanent water, including the first and last annual occurrence, historical frequency, and annual frequency of each feature. This data is organized into matrix structures and segmented using an object-oriented segmentation algorithm.
The resulting segments are classified using the Random Forest algorithm, incorporating morphological, temporal, and contextual variables. Water bodies are classified into natural and anthropogenic categories, including hydroelectric, mining, aquaculture, and other uses. Additionally, a false positive class is incorporated to correct persistent overestimations.
The process is complemented by spatial and temporal filters, the use of thematic auxiliary data, and expert review through additional sampling and manual delineation of polygons in critical areas.
Figure 3. Methodological flow of classification of water bodies in Venezuela.